爬虫代码
import requests
import xlwings as xw

url_template = "https://hz.hjhj-e.com/api/windRose/findBySearch?areaId={areaId}&timeRange=2&year=2024"
#头
headers = {
    "Accept": "application/json, text/plain, */*",
    "Accept-Encoding": "gzip, deflate, br, zstd",
    "Accept-Language": "zh-CN,zh;q=0.9,en;q=0.8,en-GB;q=0.7,en-US;q=0.6",
    "Auth": "bf6eb886-9cce-46e8-9f95-37039133583a",
    "Connection": "keep-alive",
    "Referer": "https://hz.hjhj-e.com/home/meteorologicalData/windRose/",
    "Sec-Fetch-Dest": "empty",
    "Sec-Fetch-Mode": "cors",
    "Sec-Fetch-Site": "same-origin",
    "User-Agent": "Mozilla/5.0 (Windows NT 10.0; Win64; x64) AppleWebKit/537.36 (KHTML, like Gecko) Chrome/131.0.0.0 Safari/537.36 Edg/131.0.0",
    "key": "3213c59c4ab693019b7b477fd764d0ab173215557139559",
    "sec-ch-ua": '"Microsoft Edge";v="131", "Chromium";v="131", "Not_A Brand";v="24"',
    "sec-ch-ua-mobile": "?0",
    "sec-ch-ua-platform": '"Windows"'
}
#cookies数据
cookies = {}
excel_path = "F:/work/QRA/2024风频数据.xlsx"
app = xw.App(visible=False)
wb = xw.Book(excel_path)
sheet = wb.sheets[0]

row = 1
for _ in range(3208):
    area_id = int(sheet[f"B{row}"].value)
    if not area_id:
        break
    url = url_template.format(areaId=area_id)
    response = requests.get(url, headers=headers, cookies=cookies)
    try:
        if response.status_code == 200:
            print(f"请求成功!AreaID: {area_id},目前为第{row}个数据")
            data = response.json()
            d16 = data['data']['data'][0]['d16']

            column_sums = [sum(row[i] for row in d16) for i in range(16)]
            total_sum = sum(column_sums)
            if total_sum == 0:
                print(f'{area_id}为空')
            else:
                percentages = [round(value / total_sum, 4) for value in column_sums]
                for col, percentage in enumerate(percentages, start=4):
                    sheet[row - 1, col].value = percentage

        else:
            print(f"请求失败,状态码: {response.status_code},AreaID: {area_id}")
    except KeyError as e:
        print({e})
    row += 1
wb.save()
wb.close()
app.quit()
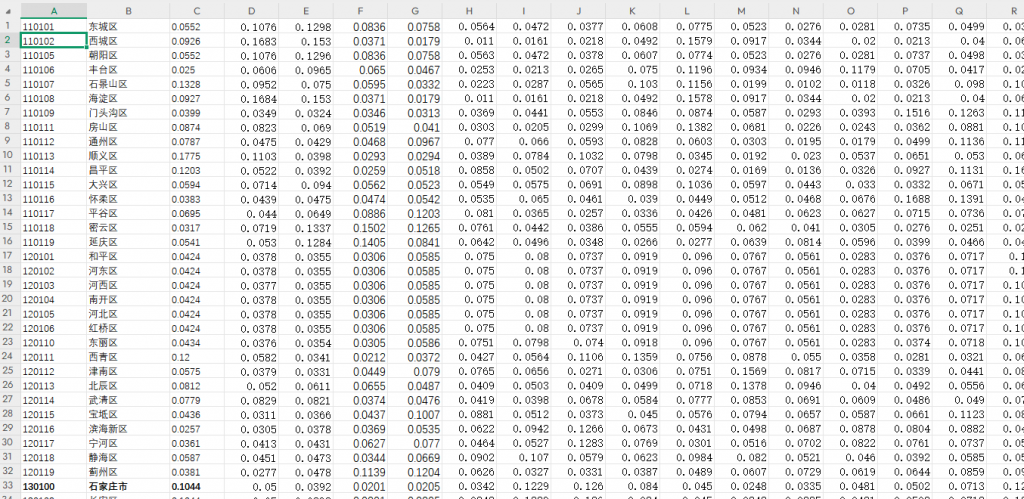
爬取的数据
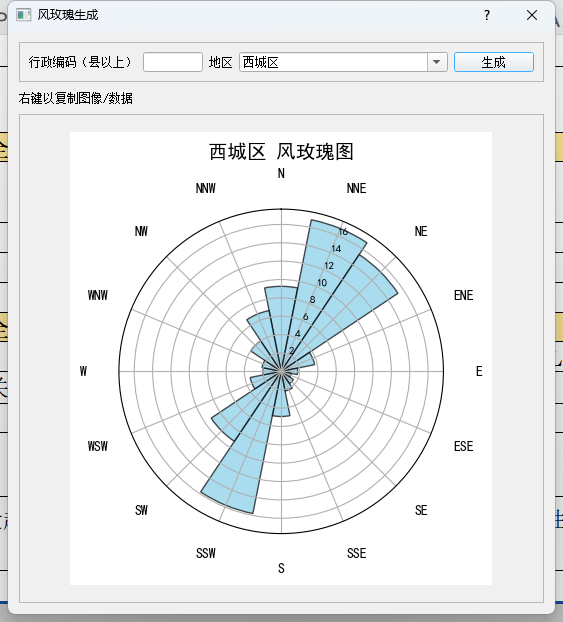
生成风玫瑰
import xlwings as xw
import matplotlib.pyplot as plt
import numpy as np
import os

EXCEL_FILE_PATH = "2023风频数据.xlsx"

def load_excel_data():
    try:
        app = xw.App(visible=False)
        wb = app.books.open(EXCEL_FILE_PATH)
        sheet = wb.sheets[0]
        data = sheet.range("C1:C3203").value
        wb.close()
        app.quit()
        return [str(item) for item in data if item]
    except Exception as e:
        raise RuntimeError(f"加载 Excel 数据失败:{e}")

def find_row_in_excel(column, value):
    try:
        app = xw.App(visible=False)
        wb = app.books.open(EXCEL_FILE_PATH)
        sheet = wb.sheets[0]
        if column == "B":
            data_range = sheet.range("B1:B3203").value
            data_range = [int(cell) if cell is not None else None for cell in data_range]
        elif column == "C":
            data_range = sheet.range("C1:C3203").value
        else:
            raise ValueError("无效的列名")
        for i, cell_value in enumerate(data_range):
            if str(cell_value) == str(value):
                row = sheet.range(f"A{i+1}:Z{i+1}").value
                if column == "B":
                    graph_title = sheet.range(f"C{i+1}").value
                    wb.close()
                    app.quit()
                    return row, graph_title
                else:
                    graph_title = None
                    wb.close()
                    app.quit()
                    return row, graph_title
        wb.close()
        app.quit()
        return None, None
    except Exception as e:
        raise RuntimeError(f"查找失败:{e}")

def generate_wind_rose(wind_frequencies, title="16-Way Wind Rose"):

    try:
        # 定义 16 个风向标签和对应的角度
        wind_directions_labels = [
            "N", "NNE", "NE", "ENE", "E", "ESE", "SE", "SSE",
            "S", "SSW", "SW", "WSW", "W", "WNW", "NW", "NNW"
        ]
        wind_directions_rad = np.deg2rad(np.linspace(0, 360, 17)[:-1])

        # 创建极坐标图
        fig, ax = plt.subplots(figsize=(6, 6), subplot_kw={'projection': 'polar'})

        # 绘制柱状图
        ax.bar(
            wind_directions_rad, wind_frequencies,
            width=np.deg2rad(360 / 16),  # 每个柱状宽度为 360° / 16
            edgecolor='black', alpha=0.7, color='skyblue'
        )

        ax.set_theta_zero_location("N")
        ax.set_theta_direction(-1)
        ax.set_xticks(wind_directions_rad)
        ax.set_xticklabels(wind_directions_labels, fontsize=10, weight="bold")

        ax.tick_params(axis='x', pad=15)
        ax.tick_params(axis='y', labelsize=8)

        ax.set_title(title, va='bottom', fontsize=14)
        fig.tight_layout(pad=3)

        output_dir = "wind_rose_images"
        os.makedirs(output_dir, exist_ok=True)
        output_path = os.path.join(output_dir, "wind_rose.png")
        plt.savefig(output_path, dpi=100, bbox_inches='tight')
        plt.close(fig)
        return output_path
    except Exception as e:
        raise RuntimeError(f"风玫瑰图生成失败:{e}")